


Background: The Watershed Fee
Background: The Watershed Fee
In 2001, the City of Bellingham established the Lake Whatcom Watershed Land Acquisition and Preservation Program, funded by a monthly fee added to every water utility bill. The fee is described publicly as a watershed protection charge supporting land conservation around Lake Whatcom — Bellingham's primary drinking water source.
What ratepayers are not told is that the same fee revenue is pledged as security for municipal bonds, that bond proceeds have been used to purchase the same watershed land, and that the land itself is carried as a non-depreciating capital asset on the utility fund's balance sheet — a structure that makes rate increases self-reinforcing.
The 2024 Washington State Auditor's Report (No. 1038218) and bond documents filed with the Municipal Securities Rulemaking Board (EMMA) establish this structure from primary sources. No figures in this report have been estimated or modeled. All data is from audited or officially published City sources.
The Fee Rate History
The Lake Whatcom Watershed fee has increased dramatically over the program's history. The most anomalous increase occurred in a single year — 2012 to 2013 — when the fee jumped +147% for a single-family customer, coinciding exactly with a major bond issuance.
| Year | Single-Family Monthly Fee | Change | Event |
|---|---|---|---|
| 2005 | $5.00 | — | Program baseline |
| 2010 | $5.00 | 0% | Fee unchanged |
| 2012 | $5.00 | 0% | Pre-bond-issuance |
| 2013 | $12.33 | +147% | 2013 Revenue Bonds issued (Aug 2013) |
| 2024 | ~$12.33+ | CPI-adjusted | Current rate (additional increases via utility rate schedule) |
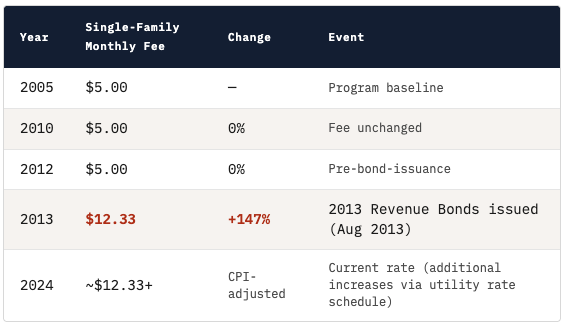
The 147% single-year increase in 2013 coincided exactly with the August 2013 issuance of $15,785,000 in Water and Sewer Revenue Bonds. The Official Statement for those bonds shows the tripled fee was counted in the coverage ratio that justified the bond issuance.
The Bond Structure — Confirmed by Official Statements
Three Water and Sewer Revenue Bonds Official Statements filed with EMMA/MSRB establish the complete financial structure.
Watershed Fees Are Bond Security
The 2013 Official Statement states in the coverage ratio footnote:
This is unambiguous: the watershed fee is not merely a conservation fund. It is pledged net revenue that mathematically supports the City's ability to issue and service municipal debt.
Bond Proceeds Were Used to Buy Watershed Land
Each bond issuance explicitly directed proceeds to land acquisition:
| Bond Issuance | Original Amount | Land Acquisition Language |
|---|---|---|
| 2006 Water/Sewer Revenue Bonds | $11,330,000 | "acquisition of real property in the Lake Whatcom Watershed" |
| 2008 Water/Sewer Revenue Bonds | $6,040,000 | "finance the acquisition of real property in the Lake Whatcom Watershed" (primary purpose) |
| 2012 Wells Fargo Revolving Note | $5,000,000 | "interim financing for the purchase of various parcels of land within the Lake Whatcom Watershed" |
| 2013 Water/Sewer Revenue Bonds | $15,785,000 | "water/sewer revenue bonds are issued to finance capital projects and watershed property acquisitions" |
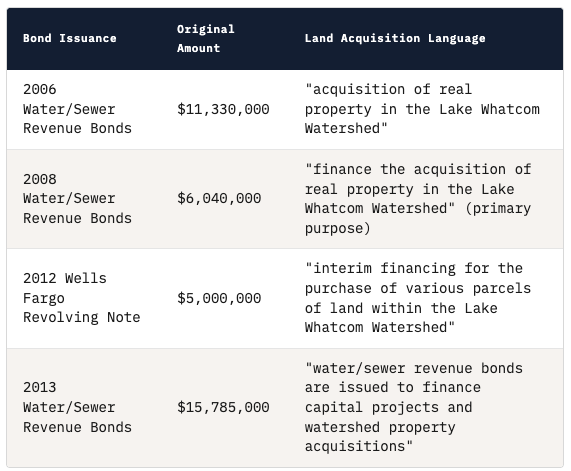
Source: EMMA/MSRB public filings for each bond issuance.
The Rate Covenant
The Bond Ordinance — authorized under RCW 39.46.150 — requires the City to maintain rates such that Net Revenue equals at least 1.25 times Maximum Annual Debt Service. This is a legal covenant with bondholders.
The coverage requirement creates a structural incentive to raise rates. When land acquisition spending increases, reserves decline. Declining reserves signal potential covenant risk. Covenant risk justifies rate increases. Rate increases restore coverage. The cycle repeats.
What the Fee Actually Funds
The 2024 State Auditor's Report (No. 1038218) and City of Bellingham Monthly Financial Reports provide the definitive breakdown of how watershed fee revenue is actually spent.
Fund 411 Watershed — Five-Year Annual Data (2021–2025)
| Year | Fee Revenue | Land Outlay | Land % of Rev | Protection Spending | Prot % of Rev | Surplus / (Deficit) |
|---|---|---|---|---|---|---|
| 2021 | $5,855,926 | $751,080 | 13% | $942,403 | 16% | +$3,161,223 |
| 2022 | $6,550,485 | $1,599,193 | 24% | $510,423 | 8% | +$3,303,676 |
| 2023 | $7,032,031 | $4,191,061 | 60% | $694,642 | 10% | +$990,943 |
| 2024 | $7,495,836 | $3,329,104 | 44% | $880,480 | 12% | +$2,058,094 |
| 2025 | $7,543,133 | $11,642,338 | 154% | $1,245,356 | 17% | ($6,635,702) |
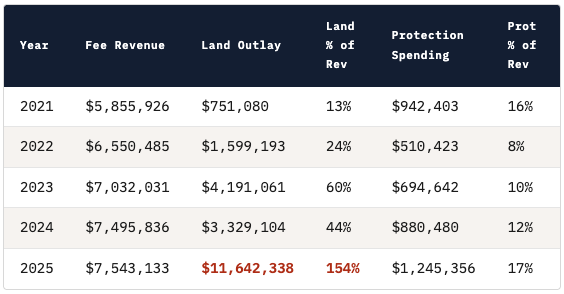
Protection Spending = Labor + Services + Supplies only. Source: City of Bellingham December Monthly Financial Reports, 2021–2025
The City ran four consecutive surplus years (2021–2024), accumulating $10.8 million in additional reserves. Those reserves were then deployed in a single year (2025) to fund an $11.6 million acquisition spike — including the Nielsen Brothers purchase: 754 acres, $3.65 million, January 2025. The City did not run out of money accidentally; it saved up to make a big purchase.
Actual Lake Protection: 6 Cents Per Dollar
Despite five years of watershed fee collection totaling over $34 million (2021–2025), the 2024 State Auditor's Report separately identifies only one specific watershed protection expenditure:
| Program | City Contribution (2024) | Fee Revenue (2024) | Cents per Dollar |
|---|---|---|---|
| Aquatic Invasive Species (AIS) Boat Inspections | $445,316 | ~$7,300,000 | ~6¢ |
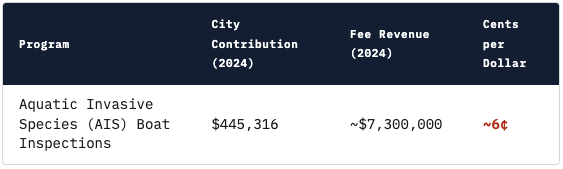
The AIS program is the only expenditure the State Auditor separately identifies as a watershed protection activity. Against approximately $7.3 million collected in watershed fees in 2024, 6 cents of every dollar goes to an identifiable protection program.
The Land Asset Mechanism
The 2024 State Auditor's Report, Page 50 establishes the accounting treatment for City capital assets:
| Asset Category | Capitalization Threshold | Useful Life | Depreciates? |
|---|---|---|---|
| Land | Any amount | No limit | Never |
| Buildings | $50,000 | 20–50 years | Yes |
| Infrastructure / Improvements | $50,000 | 20–50 years | Yes |
| Machinery & Equipment | $10,000 | 3–25 years | Yes |
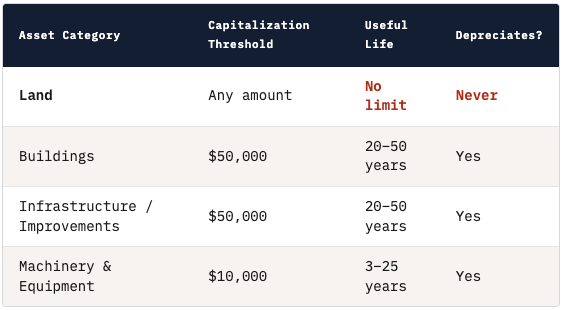
The watershed fund's cumulative land asset balance reached $61,892,995 as of December 31, 2024 (State Auditor's Report, Note 6, Page 62). The watershed fund (Fund 411) recorded $0 in depreciation in 2024 — while Water recorded $3.57M, Wastewater $4.47M, and Storm & Surface Water $1.5M in depreciation expense.
Every land purchase, regardless of size, is capitalized immediately and remains on the balance sheet at full purchase price indefinitely. The asset base only grows — and a growing, permanent asset base supports larger future bond capacity.
The Complete Financial Loop
The following mechanism is fully documented from the City's own filings. Each step is sourced to a primary document.
The Ratepayer Pays Twice
Under this structure, Bellingham ratepayers effectively pay for watershed land twice: first as watershed fees that fund or repay bond proceeds used to buy land, and second as rate increases required to maintain the 1.25× bond coverage ratio — coverage that is calculated using the same watershed fees.
The stated justification for the fee — watershed protection — accounts for approximately 6 cents of every dollar collected. The remaining 94 cents supports land acquisition, bond financing, utility taxes, and fund operations.
Why Land Wins Over Stormwater — Every Time
The Washington State Department of Ecology is unambiguous about what is actually polluting Lake Whatcom:
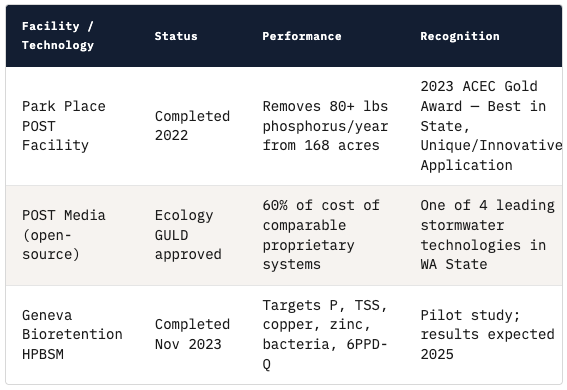
Buying forested land that was never going to be developed does not address a single square foot of existing impervious surface. The City of Bellingham developed a world-class stormwater treatment solution that does:
| Facility / Technology | Status | Performance | Recognition |
|---|---|---|---|
| Park Place POST Facility | Completed 2022 | Removes 80+ lbs phosphorus/year from 168 acres | 2023 ACEC Gold Award — Best in State, Unique/Innovative Application |
| POST Media (open-source) | Ecology GULD approved | 60% of cost of comparable proprietary systems | One of 4 leading stormwater technologies in WA State |
| Geneva Bioretention HPBSM | Completed Nov 2023 | Targets P, TSS, copper, zinc, bacteria, 6PPD-Q | Pilot study; results expected 2025 |
The Cost Comparison
| Approach | Investment | Annual P Reduction | Cost per lb/year | % of TMDL |
|---|---|---|---|---|
| Watershed land acquisition (actual) | ~$103M (2001–2025) | ~200 lbs/year | ~$515,000/lb | <6% |
| POST stormwater (pre-2022 pricing) — hypothetical | ~$103M | ~2,943 lbs/year | ~$35,000/lb | 93% |
| POST stormwater (current pricing, 40% cheaper) — hypothetical | ~$103M | ~4,905 lbs/year | ~$21,000/lb | 156% — exceeds TMDL |
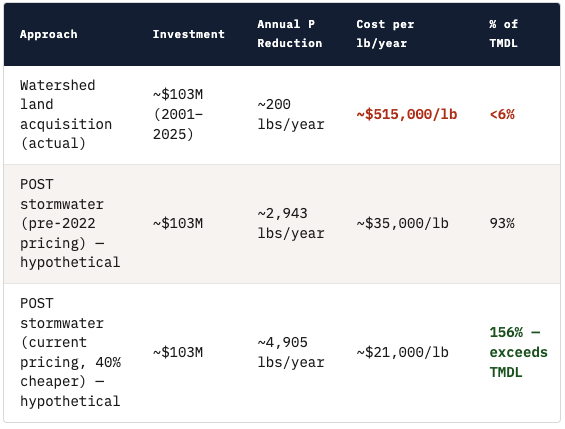
The same $103 million spent on watershed land over 25 years — delivering less than 6% of required annual phosphorus reduction — could have funded enough POST stormwater infrastructure to meet or exceed the entire 50-year TMDL requirement. Instead, Site 1 dissolved oxygen has not improved in 36 years.
Why the Financial Structure Chooses Land Anyway
This is not a claim of bad faith by individual staff or elected officials. It is a structural observation about how the bond program's accounting rules shape institutional incentives. The program that was sold to ratepayers as watershed protection has — by design of its financial structure — spent $103 million optimizing for bond collateral rather than lake health.
The April 1, 2026 Joint Councils Meeting
On April 1, 2026, the Lake Whatcom Management Program held its annual Joint Councils and Commissioners Meeting — the one occasion each year when the Bellingham City Council, Whatcom County Council, and Lake Whatcom Water and Sewer District Commissioners meet together to review watershed program progress. Real Briefings attended and obtained the closed caption transcript (City of Bellingham Agenda Item 24873).
The 50-Year TMDL Graph — Staff Refused to Show It
The Lake Whatcom TMDL is a legally enforceable 50-year cleanup mandate. When asked whether the program is on track, City Stormwater Manager Jason Porter responded:
Ten years into a 50-year legal mandate, the program cannot — or will not — show elected officials and the public whether it is on track.
The Numbers — Disclosed by the Public, Not Staff
The actual phosphorus reduction figures were not presented by staff. They were disclosed by a member of the public during the comment period:
| Entity | TMDL Annual Target | 2025 Actual Reduction | % of Target |
|---|---|---|---|
| City of Bellingham | 330 lbs/year | ~200 lbs/year | 61% |
| Whatcom County | 1,200 lbs/year | Not disclosed | Unknown |
| Total Program | 3,147.8 lbs/year | <200 lbs/year | <6% |
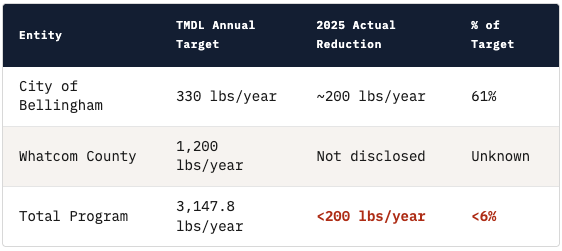
Source: Public comment by Dr. Susan Kane Ronning, April 1, 2026 JCC Meeting
What Elected Officials Said on the Record
These statements were made by elected officials who vote on the watershed fee rate, approve the annual budget, and serve on the policy body that oversees the program. The accountability gap is acknowledged by the governing body itself.
Also Omitted from the Staff Presentation
The Washington State Department of Natural Resources is proposing to auction 128 acres of timber inside the Lake Whatcom watershed in August 2026, using variable retention harvest (clear-cut with an average of 8 trees per acre remaining). This was disclosed by a nonprofit director during public comment — not by staff — four months after the largest single land acquisition in the program's history.
What the City's Own Stormwater Manager Said — On the Record
Real Briefings does not interpret or editorialize what happens in public meetings. We print what was said. The following are verbatim quotes from City of Bellingham Stormwater Manager Jason Porter at the April 1, 2026 Joint Councils and Commissioners Meeting — the one annual accountability session for a program that has collected $103 million from ratepayers since 2001.
He Didn't Have the City's Own Number
Councilmember Boyle asked a direct question about the City's phosphorus reduction figures. This is the primary TMDL metric. This meeting exists to report on it. Porter's response, at 19:39:25:
"I could tell you what the city of Bellingham's reduction in effective developed acres is. I don't have my phosphorus reduction number right now. I could do the… yeah."
He then trailed off. The City's Stormwater Manager, at the annual TMDL accountability meeting, could not produce the City of Bellingham's phosphorus reduction number when asked directly by an elected official. The number was eventually supplied — not by staff — but by a member of the public during the comment period.
He Wouldn't Show the Progress Graph
Councilmember Stone asked the direct question: "Are we on track?" Porter's response, at 19:50:16:
"We, in the past, we've shown that graph, that 50-year graph that shows where we're at and where we're going. We can't really show that right now. It wouldn't be prudent to because that reassessment is underway, and until that reassessment is conducted, it's really… it's going to be hard to say we're doing great or what."
And at 19:51:07:
"Right now is not the time to be able to really look at where we're at, because we're waiting for that reassessment to be completed."
This meeting has been on the calendar since 2016. It happens every April. The 50-year TMDL graph has been shown at prior annual meetings. The reassessment being "underway" was not a surprise that emerged the morning of April 1st. Porter came to the annual accountability meeting without the accountability slide — and without the primary metric number — for a program ten years into its legally enforceable 50-year mandate.
We don't write what we think happened. We print what was said — verbatim, timestamped, sourced to the public record. What they say is what we print.
The City/County Comparison — What the Record Actually Shows
During the policy discussion, a Whatcom County Council member acknowledged the structural disparity between the two jurisdictions at 19:52:40:
Whatcom County's own staff had already disclosed the same structural gap during the presentation at 19:46. Gary Stoica, Whatcom County Natural Resources Manager:
The City of Bellingham is praised for "doing such an excellent job" at land preservation — land preservation documented in this report as delivering less than 6% of required phosphorus reduction at $515,000 per pound per year. The County, which has no dedicated utility ratepayer revenue stream and would need to go to voters for equivalent funding authority, is noted as having "a further distance to travel." The County isn't behind because it isn't trying. It's behind because it doesn't have access to the same guaranteed, ratepayer-funded borrowing mechanism the City has operated since 2001. The metric being used to measure performance — acres of land purchased — is the same metric that drives the financial loop documented in this report.
Questions for Further Investigation
This research establishes the financial mechanism. The following questions have not been answered by publicly available documents and merit formal public records requests or Council inquiry:
- 01 Council disclosure: Were ratepayers or City Council members informed that watershed fees would be counted as bond security in the coverage ratio? Were residents informed that fee increases were structurally linked to bond issuance capacity?
- 02 Investor disclosure vs. actual allocation: The 2013 Bond OS represented to investors that approximately 30% of fees would go to land acquisition. By 2025, land acquisition reached 154% of fee revenue. What accounts for this discrepancy, and was it disclosed to bondholders?
- 03 TMDL progress disclosure: When the ecology reassessment concludes, will the City provide a full public accounting of progress against the 50-year legal mandate? If the program is at less than 6% of required annual phosphorus reduction after 10 years, what corrective action is planned?
- 04 System Development Charges: SDCs are legally intended to fund capacity expansion for new connections. No sewer capacity has been added since 2014. SDC collections have tripled to $6.9M/year. Where have the estimated $52 million in SDCs collected since 2012 been spent?
- 05 Rate Study documentation: Has the City ever commissioned a formal rate study specifically for the watershed fee? If so, what capital investment projections were used to justify the fee level?
- 06 Conservation easement structure: Properties are described as having conservation easements held by Whatcom Land Trust. If land carries encumbrances limiting development, what is its actual value as bond-supporting collateral?
- 07 Next acquisition cycle: The fund ran surpluses for four consecutive years before the 2025 mega-acquisition. Is the City currently accumulating reserves for the next cycle? What acquisition targets are under consideration, and what rate increase will be required?
Primary Sources
All figures are from audited or officially published City sources. No figures have been estimated or modeled. Financial figures were extracted from Azure Document Intelligence-processed PDFs of official City of Bellingham financial documents stored in the Real Housing Reform Initiative SharePoint repository.
meetings.cob.org
emma.msrb.org
portal.sao.wa.gov
cob.org/government/finance/financial-reports
emma.msrb.org
app.leg.wa.gov/RCW/default.aspx?cite=39.46.150
cob.org — Lake Whatcom Property Acquisition Program
Cascadia Daily News, January 28, 2025